What is a gantt chart?
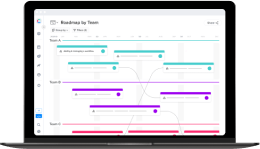
A Gantt chart is a project management approach that depicts tasks as bars extending throughout a given period. The Gantt chart informs teams of what needs to be done when required and who is responsible for it.
Even though Gantt charts improved management flows, they required a time-consuming creation process. Each chart was created by hand, which meant that any changes to a project necessitated manual revisions and a significant amount of time wastage. Due to the advent of the digital age, Gantt charts have gained popularity as updates are now as simple as pressing a button.
The history of Gantt Charts
The history of the Gantt chart begins in the 1890s, when Karol Adamiecki, a Polish engineer with interest in improving management procedures at his steelworks facility, devised the first version of the chart. Adamiecki’s approach was to create a chart by hand that visually answered the most important issues connected to any specific project’s requirements.
During the first decade of the twentieth century, Henry Gantt, an American mechanical engineer and project consultant, devised his version of a chart similar to the one used today. As a result, it gained widespread acceptance throughout the western world. Eventually, it became a necessary component of modern project management, earning it the name of the American who invented it.
The Importance of Gantt Charts
Gantt charts are still widely used in project management in various sectors. The Project Management Institute found towards the end of the second decade of the twenty-first century that just 11% of businesses were genuinely agile. In addition to agile approaches, most firms use waterfall project management methodologies (typically at the highest management levels). This is referred to as a hybrid strategy. If you think about deadlines or dates, you’re one of the people who need timeline-based Gantt charts.
A Gantt chart is an excellent tool for prioritizing work and strategically dispersing idle time throughout the project’s roadmap so that the project does not fall behind schedule.
Through Gantt charts, project managers can ensure that a project is completed within a specified timeframe by successfully planning, tracking, and staying on top of work during the project’s duration.
However, while the Gantt chart has grown as a helpful tool for project management in general, it has also been tailored to meet the specific needs of software development projects. Using a Gantt chart, software development teams can keep track of important tasks as they progress through the fast-paced stages of product development and avoid losing sight of them.
Dependencies
Dependencies are those specific tasks linked to one another by constraint-based connections. They are defined as follows: In layman’s terms, they are tasks that you cannot undertake until a previous job has been completed. This frequently occurs during the development process since you cannot test a notion with consumers unless you first create a mockup or prototype
The Pros And Cons of Gantt Charts
Using Gantt charts in your team can provide a lot of essential advantages, including the following:
It provides an accurate assessment of the difficulty of a project
The Gantt chart visualizes all of the information needed to complete a project on schedule correctly. It accomplishes this by visually depicting, in a logical sequence, the tasks that you, as a company owner, must perform and the resources required to complete them.
It create simplicity
The use of graphical representations makes it simple for team members to comprehend the project’s roadmap regardless of their backgrounds. In addition, by understanding how their duties can impact other project initiatives, they will be more driven to stay on schedule.
Streamlining communication helps you save time.
Software teams can see updates and progress statuses using the Gantt chart instead of spending valuable time in lengthy meetings. The graph will provide significant insights about schedules and resources, making it simple for members to identify who they need to communicate with and when to share.
It Aids in the efficient management of teams and resources
The Gantt chart allows product managers to visualize the critical route of a project, which will enable them to allocate groups and resources more effectively. This feature will increase the project’s efficacy while also preventing it from being derailed by inaccurate estimates in the first place.
However, while the Gantt chart has the potential to be revolutionary in project and product management, there are several disadvantages to consider.
It is complicated
Because of the increasing complexity, it may become difficult to interpret.
Large projects with diverse tasks, sub-tasks, and dependencies will be challenging to manage with a Gantt chart as a visual representation. After all, the primary advantage of the technique is that it promotes clarity through straightforward illustrations.
Consequently, the complexity of large-scale projects can make deciphering a Gantt chart a frustrating experience. Alternatively, project managers can divide the project into numerous acts, each with its own Gantt chart, to counterbalance the problem.
It is not an easy-to-understand representation of the burden
A Gantt chart is a simple tool for capturing the time range you must complete a task, but it provides little information on the effort required to complete the job.
Burnout among employees and timelines that are impossible to meet are two consequences. Instead, the time and effort required to complete each work should be considered when allocating resources.
It is necessary to keep the system up to date.
Modern software projects, particularly those guided by an agile methodology, are characterized by flexibility. Those modifications must be represented on the project’s Gantt chart — but doing so adds to your already-heavy workload!
The benefits of using a Gantt chart can outweigh the time and effort required. Furthermore, utilizing software to construct Gantt charts allows your company and product management to implement these modifications with the slightest difficulty.
Where, When, and who can use a Gantt Chart
A Gantt chart, which is intuitive and time-saving, helps bring digital teams together and keep members focused on the scope of work as they advance through the software development lifecycle.
During the first stages of a software project, you can use a Gantt chart to demonstrate the scope of the project by allowing the depiction of the project’s “critical path.” Generally speaking, the “critical path” is a sequence of tasks that you must complete for a project to be considered successful.
Product managers and development teams can use Gantt charts to map out the issues that need to be resolved to move the project forward with a more precise degree of detail.
The introduction of so-called “slack time” — the length of time you can postpone a non-essential activity — can help improve the efficiency of dependency management.
For example, a Gantt chart allows product managers to plan and track the development process while also coordinating the efforts of multi-functional teams that include product managers, user experience designers, and front-end and back-end engineers.
Conclusion
As we already mentioned, A Gantt chart is intuitive and time-saving. It helps bring digital teams together and keep members focused on the scope of work as they advance through the software development lifecycle.
Gantt charts simplify project managers to determine the crucial route to project completion and guarantee that no activities are delayed. Gantt charts should be used by project managers for project planning and scheduling, resource allocation, following the status of each job at all times, and guaranteeing the smooth and timely execution of essential activities.


